
How efficiency is measured
How efficient the SPEEDHUB is, is summed up in Efficiency. This article is about why different measurements get different numbers for the same drive — and how Rohloff measured.
1. Pedalling is not steady
Section titled “1. Pedalling is not steady”A rider pedals at a nearly constant cadence, but the torque pulses hard within each crank turn: measurements showed about 5% variation in cadence but more than 90% in torque. Every part that carries the load — chain, chainring, bearings, gears — is loaded and unloaded twice per turn.
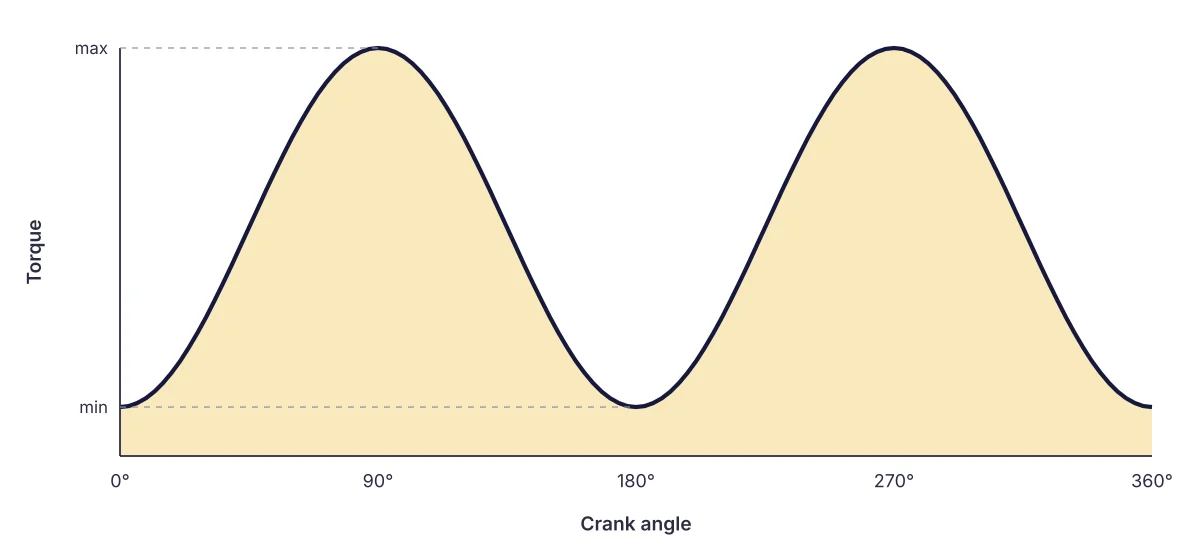
| Power and cadence | 100 W, 75 rpm | 300 W, 75 rpm | 575 W, 50 rpm |
|---|---|---|---|
| Peak torque | 21.6 Nm | 68 Nm | 200 Nm |
| Minimum torque | 3.8 Nm | 8 Nm | 20 Nm |
Test rigs are driven by an electric motor with steady torque. So the question is which constant power matches the real, pulsing load. Rohloff’s chain and chainring wear rig gave the answer: parts ridden at an average 150 W, pulsing between 5 and 30 Nm, only wore like the test parts run at a constant 30 Nm. Since wear and friction losses come from the same factors, a rig has to work at the torque’s peak, not its average — put simply, an 80 W ride is reproduced at the same cadence with about 160 W on the rig.
2. Two kinds of loss
Section titled “2. Two kinds of loss”- Load-dependent loss: friction of the parts moving under load — chain links, gears, bearings. It grows in proportion to the power transmitted.
- Load-independent loss: seals, running surfaces, the lubricant being churned. It does not depend on the driving force, only on speed, temperature and the lubricant’s viscosity.
Two made-up drives, both 91% efficient at 50 W:
| Input power | 50 W | 100 W | 200 W | 300 W | 400 W | 500 W |
|---|---|---|---|---|---|---|
| System A: 7% + 1 W | 91.0% | 92.0% | 92.5% | 92.7% | 92.75% | 92.8% |
| System B: 3% + 3 W | 91.0% | 94.0% | 95.5% | 96.0% | 96.3% | 96.4% |
At low power the load-independent loss dominates, at higher power the load-dependent one. Curves C and D are the same drives when the seal loss rises from 1 W to 2 W through heat or a change in the lubricant film (A → C), or drops from 3 W to 2 W (B → D):
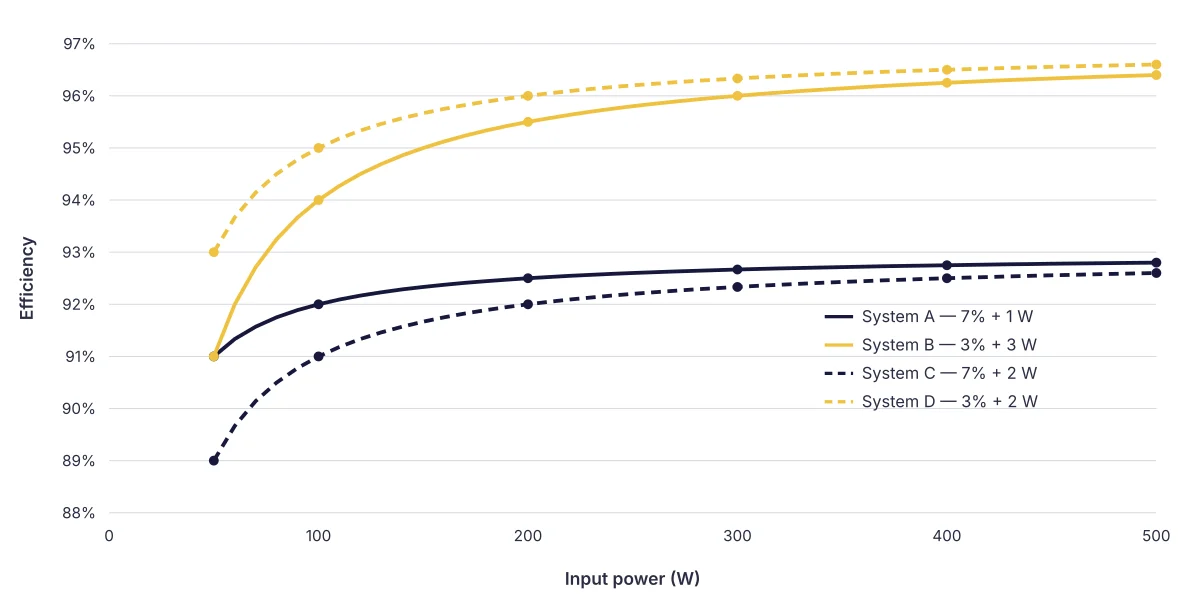
Below 200 W, a swing of just ±1 W moves the result by several per cent — and it can happen within one measurement, because the friction heat itself changes the conditions. So below 200 W an efficiency figure is only valid from many repeated runs, and always as a band with upper and lower limits. Above 200 W the swing becomes negligible.
3. Your efficiency counts too
Section titled “3. Your efficiency counts too”The goal is not the best mechanical number but how much of the energy you put in becomes forward motion. Muscle efficiency reaches about 25% at the right force and movement speed, but in an unsuitable gear it is easily 10 percentage points worse — far more than the difference between gear systems.
| Efficiency | Rider A | Rider B |
|---|---|---|
| Muscle efficiency | 24% | 22% |
| Drive efficiency | 93% | 97% |
| Overall | 22% | 21% |
Rider A, in the right gear, is more efficient with the worse drive than rider B in the wrong gear. Sports medicine puts the step between gears below 15% for neighbouring gears to fit both up and down — which is why range and number of gears always belong next to efficiency. See Gear ratio comparison.
4. Rohloff’s measurement
Section titled “4. Rohloff’s measurement”The whole drive was measured — bottom bracket, chain, chainrings, hub or gearbox — simulating a sporty rider at about 160 W with 50 Nm torque peaks (285 N on the pedal):
| Parameter | Value |
|---|---|
| Cadence | 60 rpm |
| Brake power (constant) | 314 W |
| Drive torque | 50 Nm |
For comparison a 24-speed derailleur (46, 36 and 26-tooth chainrings, 11–28 cassette) and a SPEEDHUB (46/16) were run, both bedded in for about 100 km. The runs were repeated several times; the tolerance is ±0.5%.
- Derailleur: measured clean and well lubricated, then with a dirty chain and sprockets that had done about 1,000 km — with the used parts, efficiency was on average 1% lower.
- SPEEDHUB: also measured with a 1,000 km chain and sprocket — no measurable difference.
The SPEEDHUB’s efficiency follows exactly how many planetary stages carry load in each gear:
| Gear | 1 | 2 | 3 | 4 | 5 | 6 | 7 | 8 | 9 | 10 | 11 | 12 | 13 | 14 |
|---|---|---|---|---|---|---|---|---|---|---|---|---|---|---|
| Stages under load | 2 | 2 | 3 | 1 | 3 | 2 | 2 | 1 | 1 | 2 | 0 | 2 | 1 | 1 |
Best is gear 11 — the direct gear, with no stage working. Gears 1–7 trace the same pattern as gears 8–14, only about 2% lower, because the third stage reduces there as well. Which stage works in which gear: The 14 gears inside.
Worth remembering
Section titled “Worth remembering”- A constant-torque measurement below 200 W means little in practice — at a sporty pace a rider puts out well over 100 W.
- Compare efficiency always with its tolerance band, and together with range and number of gears.
- Dirt, lubrication and wear affect open drives most — the sealed SPEEDHUB hardly at all.
Frequently asked questions
- Why do makers measure different efficiencies for the same drive?
- Because much depends on how you measure. Below 200 W, small swings in the seals' constant friction move the result by a few per cent; and a test rig's steady torque is not like the pulsing load of pedalling. Rohloff therefore measures at 314 W with a constant 50 Nm, repeated several times.